


Introduction:
Describe the expanding requirement in monitoring systems for long-term storage and scalable metric gathering. Present Thanos as an open-source initiative aimed at resolving these issues and enhancing Prometheus' potential.
What is Thanos Metrics?
British gaming technology startup Improbable developed the open-source Prometheus plugin known as Thanos. The project's objective, as disclosed by Improbable in their blog post announcing the launch of Thanos, is "to seamlessly transform existing Prometheus deployments in clusters around the world into a unified monitoring system with unbounded historical data storage."
Users can create extremely accessible metric systems with virtually infinite storage by integrating Thanos with Prometheus. When deployed, Thanos offers advantages including high accessibility (HA), a global query view, and reasonably priced access to historical data in a single binary.
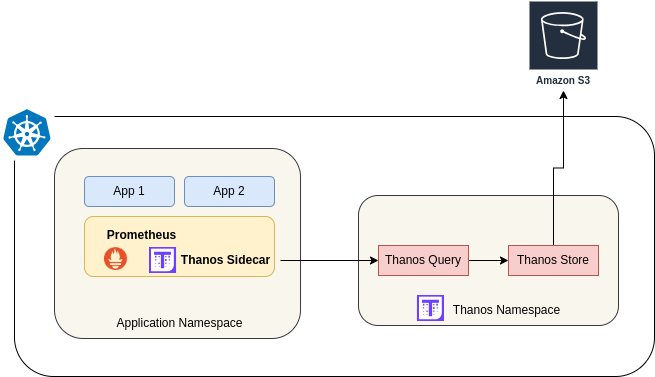
Simple-Architecture
Key Features:
The integration of Thanos with Prometheus delivers a concise set of crucial capabilities:
Global Query View: Thanos combined with Prometheus enables a unified, global view for querying metrics across multiple instances without accessing each one separately.
High Availability: This fusion ensures continuous access to metric data by leveraging Thanos' fault-tolerant features alongside Prometheus' monitoring capabilities.
Historical Data Availability: By integrating with object storage, Thanos extends Prometheus' capacity for cost-efficient, long-term storage, allowing access to historical metric data for trend analysis and decision-making.
Cost Efficiency: Thanos' integration with object storage systems offers an economical solution for retaining historical metrics over time, minimizing infrastructure costs.
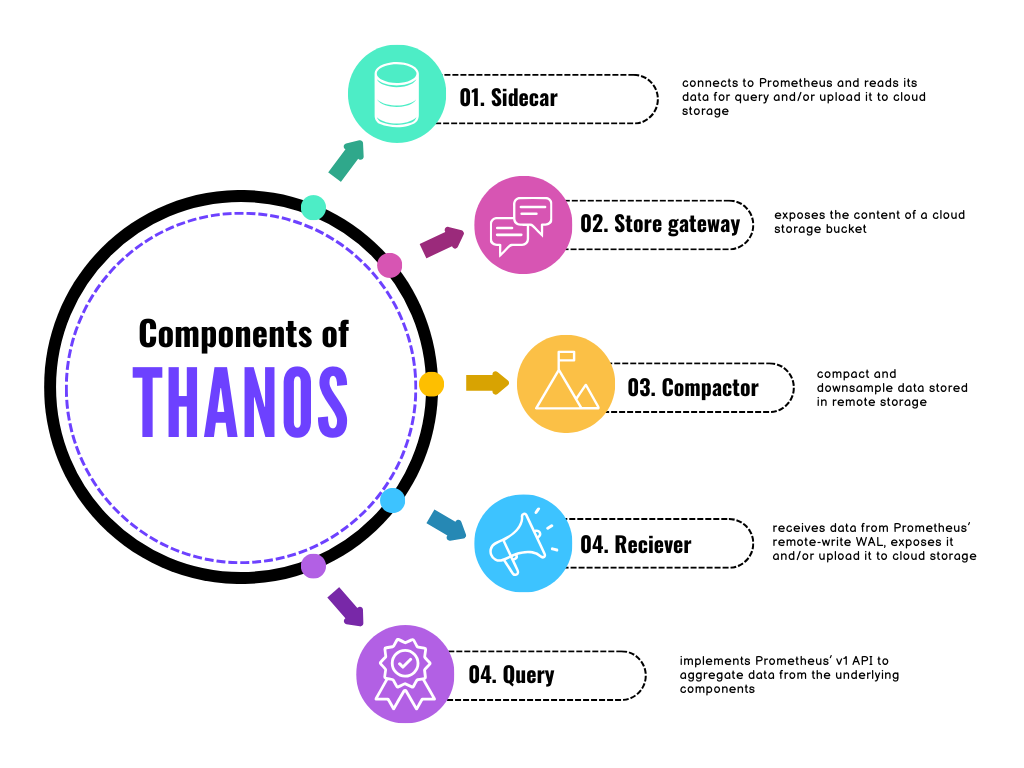
Components of Thanos
How to Setup it?
Installation
I am using the official Thanos manifests and the Kube-Prometheus Helm chart from Bitnami Charts for installation.
Step 1: Pull the helm charts to your local
helm repo add bitnami https://charts.bitnami.com/bitnami
helm pull bitnami/kube-prometheus
Step 2: Untar the file and open it in an editor (VS code)
tar -xvf kube-prometheus-8.22.5.tgz
Step 3: Enable Thanos sidecar creation in the values.yaml
thanos:
   ## @param prometheus.thanos.create Create a Thanos sidecar container
   create: true
Step 4: Change the service type from ClusterIP to LoadBalancer
service:
   type: LoadBalancer
Step 5: Change the retention period and disable compaction accordingly
retention: 12h
disableCompaction: true
Step 6: Enable the storage config to store the metrics to s3
objectStorageConfig:
     secretName: thanos-objstore-config
     secretKey: thanos.yaml
Step 7: Create a new file as s3.yaml and configure it accordingly
type: s3
config:
  bucket: <bucket-name> #S3 bucket name
  endpoint: s3.<your-region>.amazonaws.com #S3 Regional endpoint
  access_key: <aws-access-key>
  secret_key: <aws-secret-key>
After adding the bucket name and access keys, we are going to use this to create a Kubernetes secret in the cluster
kubectl -n monitoring create secret generic thanos-objstore-config --from-file=thanos.yaml=s3.yaml
Step 8: Now deploy the helm chart using the below command
helm upgrade --install prometheus kube-prometheus -f values.yaml -n monitoring
After deployment, you can see the Kube Prometheus pod except Grafana is running in the cluster
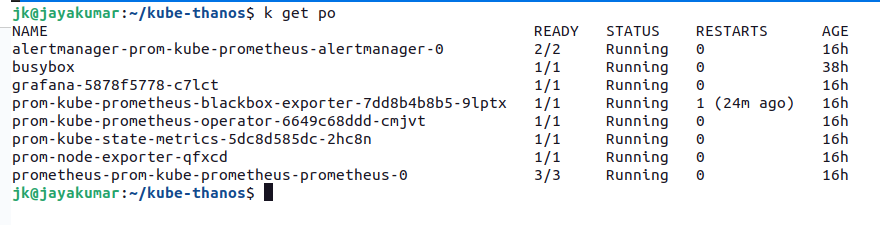
Note: After a successful deployment of Prometheus and ensuring that Thanos's sidecar is running in the kube-prometheus-0 pod
Thanos Installation
Step 1: Clone or Download the manifests from the kube-Thanos repository
https://github.com/thanos-io/kube-thanos/tree/main/manifests
Step 2: Create a namespace as thanos
kubectl create ns thanos
Step 3: Add one argument in thanos-query-deployment.yaml to query the metrics from the Thanos sidecar in the Prometheus pod
- args:
    - query
    - --grpc-address=0.0.0.0:10901
    - --http-address=0.0.0.0:9090
    - --log.level=info
    - --log.format=logfmt
    - --query.replica-label=prometheus_replica
    - --query.replica-label=rule_replica
    - --endpoint=dnssrv+_grpc._tcp.thanos-store.thanos.svc.cluster.local:10901
    - --endpoint=dnssrv+_grpc._tcp.thanos-receive-ingestor-default.thanos.svc.cluster.local:10901
    - --store=dnssrv+_grpc._tcp.<pod-name>.<namespace>.svc.cluster.local:10901
    - --query.auto-downsampling
Step 3: Add the s3 config by mapping the secret to thanos-store-statefulset.yaml
env:
 - name: OBJSTORE_CONFIG
   valueFrom:
      secretKeyRef:
        key: thanos.yaml
        name: thanos-objstore-config
Make sure that the secret we previously created should be in Thanos namespace also. if it’s not there create the same secret in the thanos namespace
kubectl -n thanos create secret generic thanos-objectstorage --from-file=thanos.yaml=s3.yaml
Step 4: Install thanos in the thanos namespace
kubectl apply -f manifests -n thanos
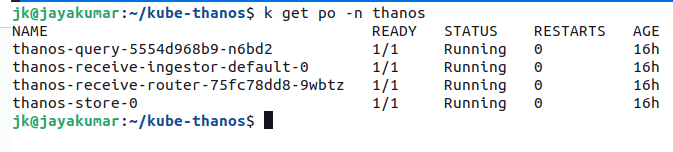
After successful installation, you can see Thanos pods coming up!!
Grafana Installation
Step 1: Use the same bitnami helm repo to pull the Grafana chart if not check the previous steps
helm install grafana bitnami/grafana
Step 2: Expose the Grafana service as LoadBalancer or port-forward the Grafana pod to see the UI
Step 3: Add Prometheus as a data source in Grafana and while giving the Prometheus URL give the Thanos-Prometheus URL to add the data source
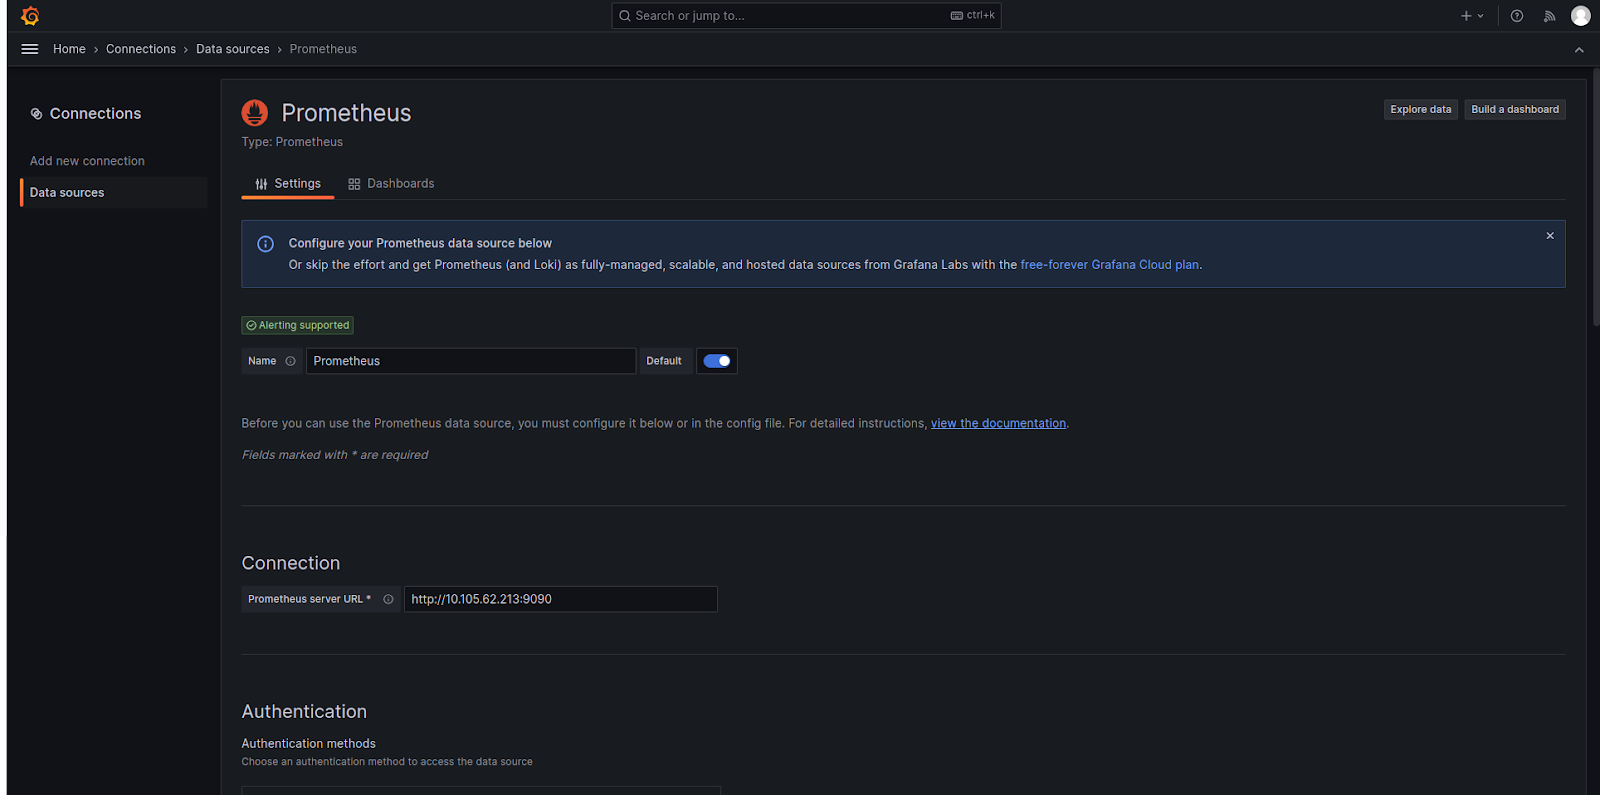
Step 4: Save and test the data source. Make sure the Prometheus URL is working.
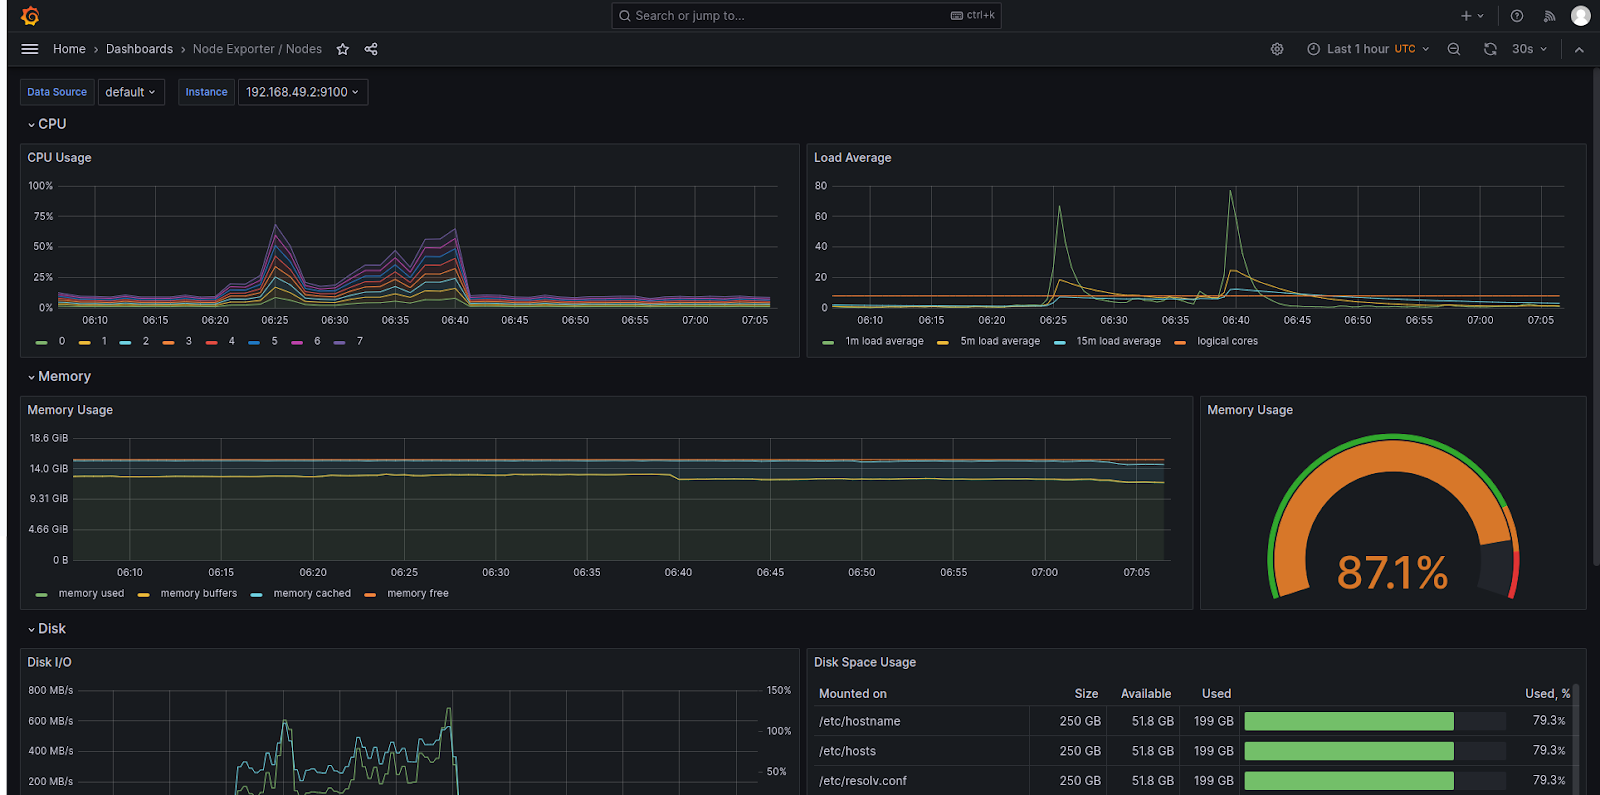
Step 5: Add some nice dashboards. For example, add a node exporter dashboard from the Grafana
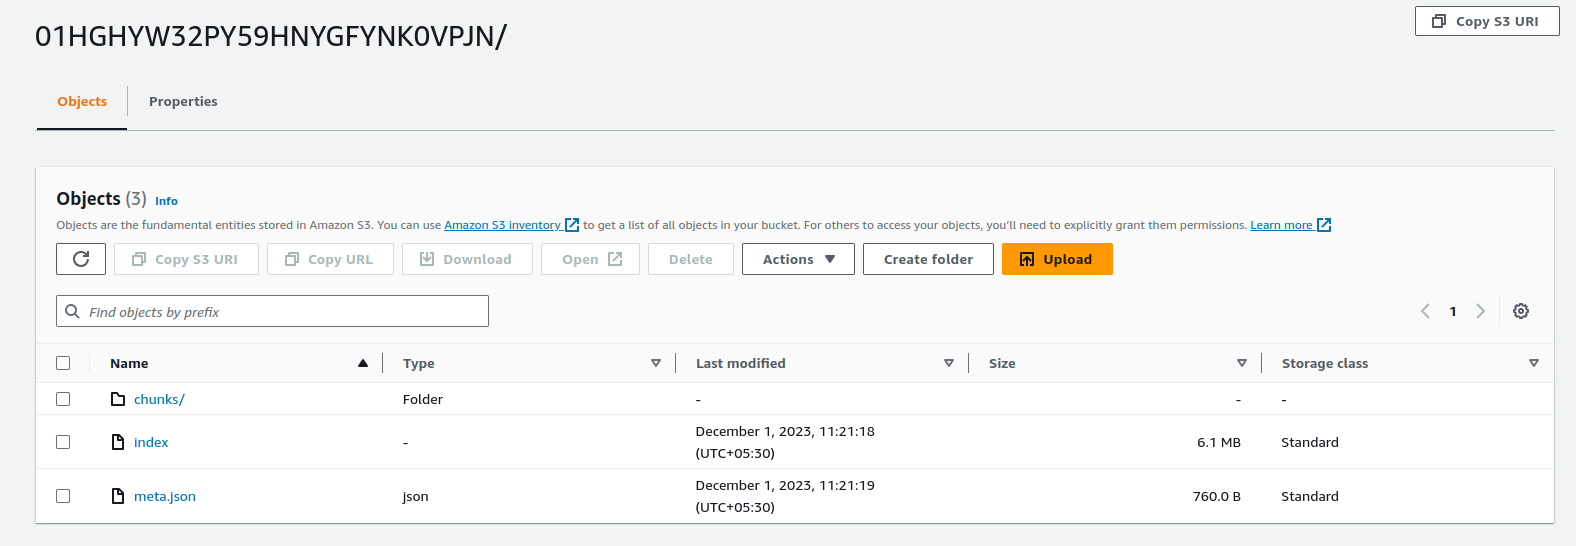
S3 Store:
You can check your s3 bucket after some 2-3 hrs. The metrics will be stored in the bucket.
That’s it…Your Thanos setup is done..No need for worries about storage full in Kubernetes workloads.
Conclusion
Culminating in a harmonious alliance, the integration of Thanos Metrics and Prometheus redefines monitoring capabilities. It simplifies the complex, empowering teams to efficiently manage and anticipate challenges in dynamic environments.