


Introduction
Victoria Metrics is a high-performance, open-source time-series database (TSDB) designed for handling large volumes of time-series data efficiently. With its scalability, reliability, and cost-effectiveness, Victoria Metrics is a powerful tool for organizations seeking to store, query, and analyze time-series data from various sources, making it an ideal choice for monitoring, IoT, DevOps, and financial analytics use cases.
Key features to remember!!
Here are the key highlights of Victoria Metrics:
1. Compatibility: Seamlessly integrates with Prometheus and Graphite.
2. Ease of Use: Simple setup and operation with a single executable and command-line configuration.
3. MetricsQL Query Language: Offers advanced querying capabilities similar to PromQL.
4. Global Query View: Enables unified data querying from multiple sources.
5. High Performance: Outperforms competitors like InfluxDB and TimescaleDB.
6. Resource Efficiency: Uses less RAM and storage space, ideal for high-cardinality data.
7. Data Protocols: Supports various protocols for data ingestion and backfilling.
8. Advanced Functionality: Includes features like stream aggregation and metrics relabeling.
9. Wide Applicability: Suitable for diverse time-series data workloads.
10. Open Source Cluster Version: Provides a scalable, open-source cluster version.
These highlights showcase Victoria Metrics as a powerful, efficient, and versatile time-series database solution.
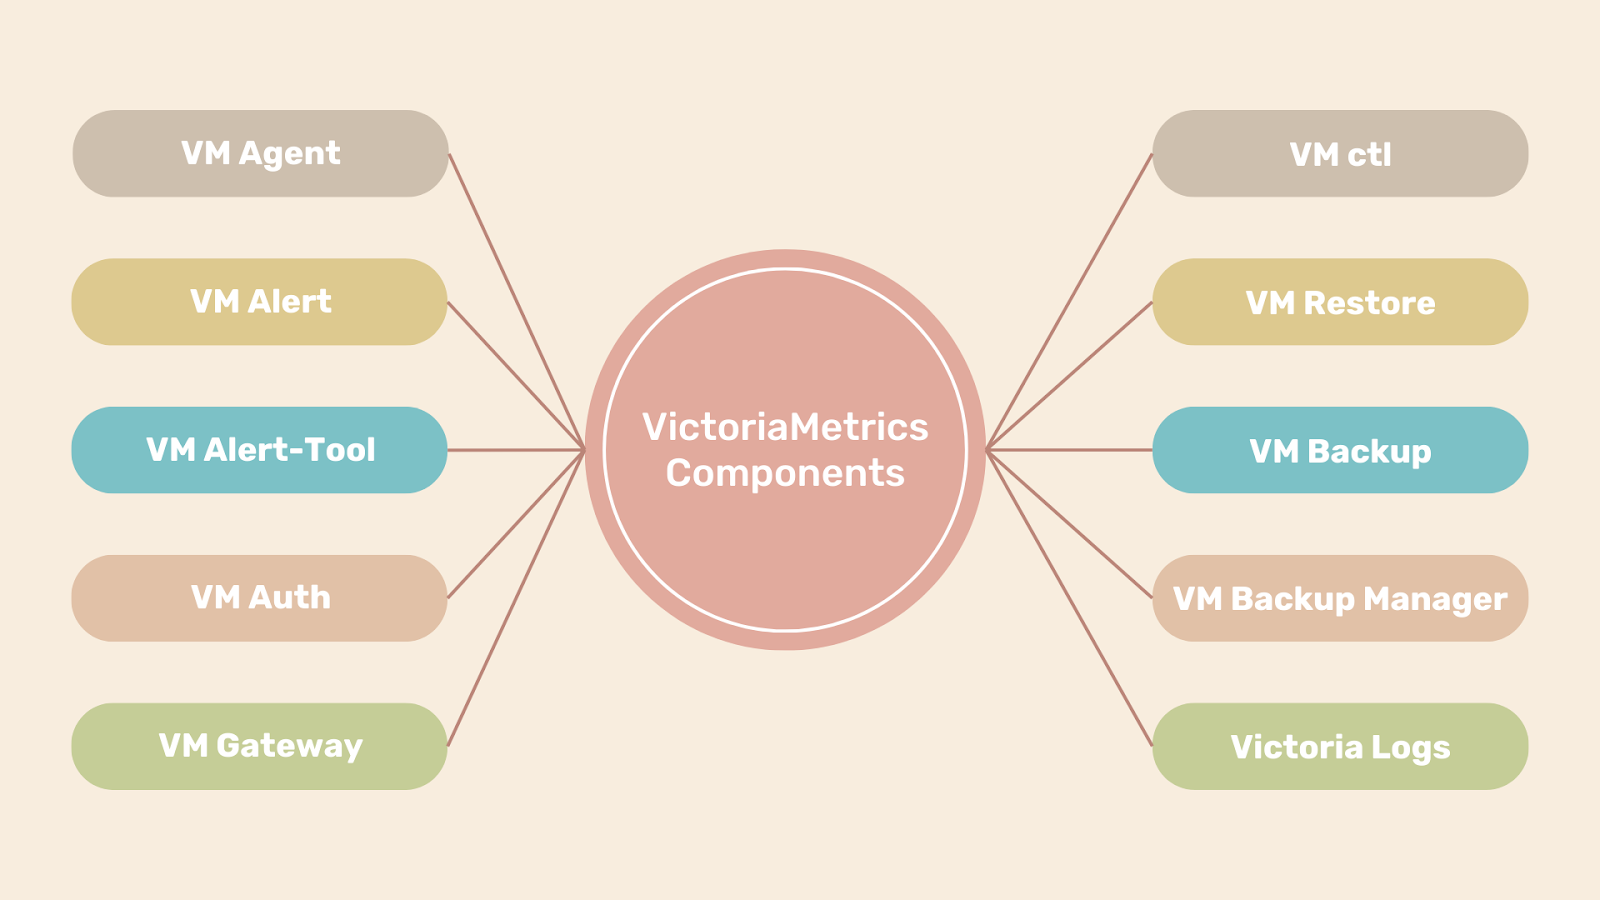
Components of Victoria Metrics
The components in the below diagram are not the complete components included.
A POC setup—how to do it?
Installation in local minikube
Step 1: Add the helmchart repository in your local
helm repo add vm https://victoriametrics.github.io/helm-charts/
helm repo update
Step 2: Search for the VM repo
helm search repo vm/
Step 3: Get the values of the helm file in your local file, and you can edit accordingly.
helm show values vm/victoria-metrics-cluster > values.yaml
Step 4: Test the installation using the below command
helm install victoria-metrics vm/victoria-metrics-cluster -f values.yaml -n NAMESPACE --debug --dry-run
Step 5: Install it using the below command
helm install victoria-metrics vm/victoria-metrics-cluster -f values.yaml -n NAMESPACE
Step 6: Check that the pods are running in the cluster
kubectl get pods -A | grep 'victoria-metrics'
# or list all resources of victoria-metrics
kubectl get all -n NAMESPACE | grep victoria

if your installation is successful, you can see the above resources in your cluster
Installation of Prometheus and Grafana
Step 1: Add the helm repo for prometheus and install it. we are using community helm charts here
helm repo add prometheus-community https://prometheus-community.github.io/helm-charts
helm show values prometheus-community/prometheus > prom-values.yaml
helm install prometheus prometheus-community/prometheus
kubectl expose service prometheus-server --type=NodePort --target-port=9090 --name=prometheus-server-np
Step 2: Integrate Prometheus with Victoria metrics using the below configuration. Add it in /etc/prometheus/prometheus.yml
remote_write:
  url: http://<victoriametrics-address>:8482/api/v1/write
Step 2: Add the Grafana helm chart and install it
helm repo add grafana https://grafana.github.io/helm-charts
helm install grafana grafana/grafana
kubectl expose service grafana --type=NodePort --target-port=3000 --name=grafana-np
Step 3: After installing the grafana helm chart, add the prometheus data source in the grafana ui, For the prometheus URL you should give the victoria metrics url.
Real time case studies
For real time case studies, you can check the list of companies here https://docs.victoriametrics.com/casestudies/
Conclusion
Victoria Metrics streamlines monitoring with robust compatibility and efficient MetricsQL. Its scalability and low resource usage make it a top choice for modern infrastructures. Elevate your monitoring game with Victoria Metrics today.